Business Edition #03 Product Colors For development of optimal color variations
Product color in the market
New products are being created every day in various fields such as fashion, products, and interior design. Some products have a single design with only one coloring, but many have the same design in multiple colors.

Designing products in any field takes a lot of time and money. In comparison, coloring, which involves dyeing the material and coloring the exterior, is relatively low cost. Moreover, by offering multiple colors, it is possible to match a wide range of user preferences, which has the advantage of increasing sales volume. Additionally, displaying multi-colored product lines at stores has the advantage of attracting more attention and making it easier to convey the image of the product brand. This type of color arrangement is called color variation or color assortment. In doing so, the important points are whether the color assortment is organized according to the purpose and whether the user's preferences are reflected.
Example of product color development (smartphone)
There are color systems to organize colors and see the big picture (see #2 Color System). Here we present the product colors of smartphones and mobile phones (total of 112 models and 361 colors) that were available in the Japanese market as of January 2013, analyzed using the Japan Color Design Institute's HUE&TONE color system.


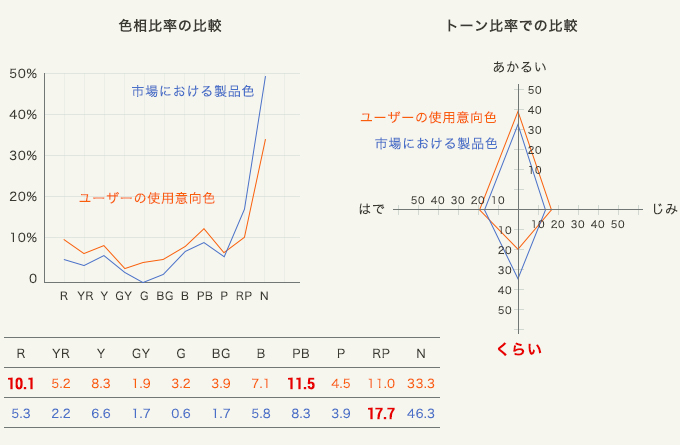
Looking at the composition ratio of each color, you can see that chromatic colors account for 53.7% and achromatic colors account for 46.3%, which is almost evenly split. The overwhelming majority of hues are RP (reddish-purple), and the tones include many vivid tones (V = Vivid Tone, S = Strong Tone) and bright tones (B = Bright Tone).

Also, when looking at the number of color variations per model, the mode is 3 colors, and the average for 8 colors or less is 2.9 colors. Furthermore, in the HUE&TONE table, if you arrange the colors in descending order of appearance, they will be white, black, and vivid pink, but in reality, this three-color combination was the most common combination. This indicates that the effect of color discrimination is not strong among product brands.
User preferences
Around the same time, we conducted a survey of 1,440 men and women from their late teens to their 60s, presenting them with 48 color chips and asking them to select the color of the smartphone/mobile phone they would like to use. As a result, 66.7% of users' intention to use chromatic colors and 33.3% were achromatic colors, indicating that they are looking for more chromatic colors than the product colors in the market.

Looking at the product colors in the market and the colors that users intend to use by hue and tone, product colors are biased towards the hue RP (reddish-purple), while users' intention to use them is towards PB (blue-purple) and R-type. You can also see that the ratio of (red) is high, and you are looking for a darker tone.
Color variations
There are basically two types of color variations. One is the color selection to cover the preferences of as many users as possible, and the other is the color selection to accurately express the product brand image. The three colors of white, black, and vivid pink mentioned earlier can be said to be an example of the former. However, the drawback in this case is that the product colors tend to be similar to those of competing brands, resulting in a lack of differentiation. On the other hand, the latter color selection has a stronger message from the manufacturer and is more distinctive. However, since the concept image is limited, the user base will also be narrowed down. In either case, it is important to increase user satisfaction across the market. We believe that an effective method for achieving this is to categorize user preferences and plan product color development based on these categories.
Typology of user color and design preferences
Now, as a manufacturer, we do not decide on the colors of all our products based on user preferences. However, as a user, you want a color that suits your taste. At that time, if the color you most want is not available on the market, you will choose an alternative color that suits your taste. Each person has a certain "direction" in their color preferences. You can group people with similar "directions" of their preferences and divide them into several types. In other words, instead of 10 people and 10 colors, we classify people with similar tastes into several types. The figure shows the results of classification into 12 types using a statistical analysis method. If you look at the diagram, you will see that types ① to ⑫ have different tastes depending on their color and tone.

For example, types ①, ③, and ⑪ all prefer black. However, type 1 prefers black as a gentle achromatic color, type 3 prefers it along with vivid warm colors and gold that give it a gorgeous image, and type 11 prefers it as a color with a deep dark tone. . In this way, it is possible to understand the meaning of different colors depending on the user based on multiple preference colors.
In the market, in order to increase user satisfaction and increase sales volume by offering a small number of colors, it is possible to understand user preferences by categorizing them and multiplying this with the brand characteristics of the product. Become. This is a color variation optimization technique.
May 20, 2015
Text by Japan Color Design Institute
Share